
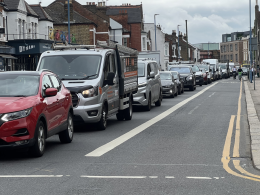
TfL data has confirmed what Putney has long known: bus passengers travelling through the redesigned Putney Bridge junction wait up to 41% longer than the rest of the borough. The junction is the cause.
The measure is Excess Waiting Time (EWT): how much longer passengers wait beyond the timetable. If a bus runs every ten minutes, the scheduled wait is five minutes. If the average actual wait is 6.5 minutes, the EWT is 1.5 minutes. TfL’s target is 1.0 minute.
In the latest quarter (September 2025 to January 2026), the borough average EWT across all Wandsworth routes was 1.1 minutes. Routes running along Lower Richmond Road (the approach most directly affected by the junction) averaged 1.55 minutes. That is 41% above the borough average, and 55% above TfL’s target.
The figure is an average across all hours. Off-peak, when the junction is clear, buses on these routes perform closer to the borough norm. The passengers bearing the worst of it are the ones who need the service most: commuters travelling in the morning rush, when the junction is at its most congested and the EWT figures are at their highest.
The junction map
Routes 22 and 265 travel along Lower Richmond Road, the approach with the worst junction exposure. Their combined average EWT in Q3 25/26 was 1.55 minutes. Route 265 alone recorded 1.6, and at its worst in Q3 24/25 it reached 2.1 minutes, the worst figure recorded across the borough.
Routes 220 and 270 use Putney Bridge Road. Their average EWT was 1.35 minutes, better than Lower Richmond Road, worse than the borough average.
The seven routes running along Putney High Street (14, 37, 39, 74, 85, 93 and 430) averaged 1.01 minutes – essentially the TfL target, and borough average.
The numbers compound. Route 265 passengers wait an average of 8.6 minutes for their bus. By the time it arrives, the next one should be close behind. It isn’t. Across Lower Richmond Road routes overall, nearly one journey in three involves a wait of more than ten minutes. Long gaps, when buses disappear entirely for an extended period, happen almost twice as often on these routes as elsewhere in the borough: 2.7% against a borough average of 1.6%.
The proof
The strongest evidence in this dataset is not the daytime numbers. It is what happens at night.
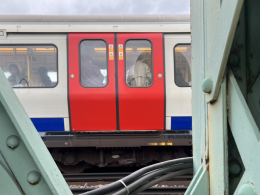
Night buses N22, N33 and N72 all run along Lower Richmond Road, the worst-performing approach during the day. In Q3 25/26, these routes recorded an on-time performance of 93.7%. The Wandsworth night bus borough average was 81.6%. The same roads, the same routes. At night, they are among the best-performing services in the borough. During the day, they are the worst.
TfL’s Director of Public Transport Service Planning, Geoff Hobbs, confirmed to Putney.news in November 2025 that “congestion in Putney is impacting operators’ ability to operate the route reliably to the specified schedule.” The night bus data confirms it: remove the junction congestion and the routes perform. The road is not the problem. The operator is not the problem. The junction is.
What the fixes achieved
The council and TfL have made at least fifteen separate interventions since the junction was redesigned in late 2024.
Lower Richmond Road received 32% more green time. Journey times fell by 32%. The correlation is near-perfect.
Putney Bridge Road received 56% more green time. Journey times improved by 3%.
The reason: 25 seconds out of every 104-second signal cycle is simply not enough to clear the queue that builds in the remaining 79 seconds. Every cycle resets. Every cycle the queue starts again. Putney High Street, by contrast, gets 43 seconds per cycle, the road TfL has historically prioritised.
There is also a deeper problem. In November 2025, AECOM, the engineers who designed the scheme, found that the signal timings had never been correctly installed. Lower Richmond Road lost ten seconds of green time compared to the approved design when the junction was built. Putney Bridge Road lost 21 seconds. The junction has been operating incorrectly from the start.
The curtailment caveat
Route 85 records an EWT of 0.9, below the TfL target. On the face of it, one of the better-performing routes in the borough.
But anyone who has taken the 85 will know that it often terminates early at Putney Heath – which is also before the next TfL monitoring point. When a bus turns back early (a practice known as curtailment), it never reaches the point where waiting time is measured. The EWT figure for that journey is not recorded as poor performance. It disappears from the dataset. TfL’s EWT target is 1.0 minute. Above it, operators face fines; below it, they earn bonuses. That incentive structure matters here.
So if even these figures seem off and don’t match your experience of waiting, that’s because the bus companies have effectively pulled the bus from service in order not to appear late. The people who are late, of course, are the passengers waiting for a bus that never turns up, or the ones pushed off the bus 20 minutes walk from their stop.
At the PTLG meeting in May 2025, Cllr Jenny Yates, Cabinet Member for Transport, acknowledged the problem directly: “Presumably [curtailments] don’t reflect what’s really going on.” Malcolm Claridge, representing First Bus London at the same meeting, explained the incentive: “If we operate below one, we get a bonus. If we operate above one, we get a fine.”
The PTLG agreed in May 2025 that TfL would circulate curtailment data for routes 85 and 170. TfL also agreed to provide an explanatory note on what EWT figures show and don’t show. Neither was delivered. The November 2025 PTLG meeting, at which this data would have been followed up, was cancelled.
We cannot say route 85 is genuinely improving. We can only say it appears to be improving on a metric that rewards curtailments. The data that would settle the question has never been published.
Route 14, previously reported as the slowest bus in the entire TfL network at 5.7mph, also records a relatively low EWT. The same caveat applies.
The three-quarter picture
Two years ago, route 378 ran on time 85.8% of journeys. In the latest quarter, it ran on time 67.3% of journeys. Route 485 has fallen from 81.8% to 65.8% over the same period. The borough average has remained flat at around 81.6%.
These are not routes that were already struggling. They are routes that declined sharply after the junction was redesigned, while the rest of the borough held steady.
Routes 22 and 378 have also had their frequencies cut by 29% and 49% respectively since 2021. Fewer buses means less resilience, and greater damage when the junction delays each one.
Three of London’s five most complained-about bus routes serve Putney. Complaints about Putney buses rose 63% over three years, based on data published in July 2025.
What you can do
The next meeting of the Putney Transport Liaison Group (PTLG) takes place on 25 March 2026, two days before the pre-election purdah period begins on 27 March. Agenda and papers are at democracy.wandsworth.gov.uk.
If you have experienced unreliable bus services in Putney, you can report directly to TfL at tfl.gov.uk/help-and-contact or submit a complaint to Wandsworth Council at wandsworth.gov.uk/complaints.
The curtailment data that TfL promised at the May 2025 PTLG meeting has never been published. You can submit a Freedom of Information request to TfL via whatdotheyknow.com, requesting curtailment rates for routes 85 and 170 by quarter.
The junction redesign has cost at least £1 million (£835,000 for the original scheme, plus £169,000 in emergency modifications). You can read previous Putney.news coverage of the junction series, including the curtailment mechanism, the ghost bus investigation, why Putney is paralysed and the council-TfL contradiction on route 424.
Hmm, let’s see. At night, the buses run freely; in the daytime, they are very slow – and “the only variable” is … the junction? Really???
The genius who wrote this tripe somehow, i don’t know how, managed to miss the bleeding obvious.In the daytime the roads are clogged up with cars, whereas at night there are many fewer.
So what, I wonder, could be holding up the buses during the day? Wait a minute, I think I’ve got it: it’s THE NUMBER OF CARS!!! Wow, who’d a thunk it, eh?
Fair point, and it deserves a direct answer.
There are more cars during the day – but “more cars” doesn’t explain why buses got worse after the junction was redesigned.
Before the redesign in late 2024, the same routes on the same roads with the same daytime traffic performed materially better. The council’s own paper, published in February 2026, confirms that morning bus journey times still haven’t returned to the pre-scheme baseline after fifteen months of fixes. Same daytime cars, different junction, worse buses.
There’s also a second problem for the cars argument: traffic volumes crossing Putney Bridge in 2024 are lower than they were in 2018, before Hammersmith Bridge closed – around 5,000 fewer vehicles per day, according to Department for Transport figures. Fewer cars than before, not more.
The article could have made both points more explicitly – that’s a fair observation.
Little surprise that Putney does not feature as one of the best places to live. Take one look at Putney High Street. It is constantly clogged with traffic, and the High Street is a tumbledown disgrace. Many shops are closed, some of them have been neglected to the extent that squatters have moved in, there is little thought to the quality of shopping including a large arcade. Where Putney High Street meets Putney Bridge has forever been in the doldrums and it is astonishing that no one has picked up this prime piece of riverfront area and made it work as a destination. Maybe this report will galvanise a few people into Action.