
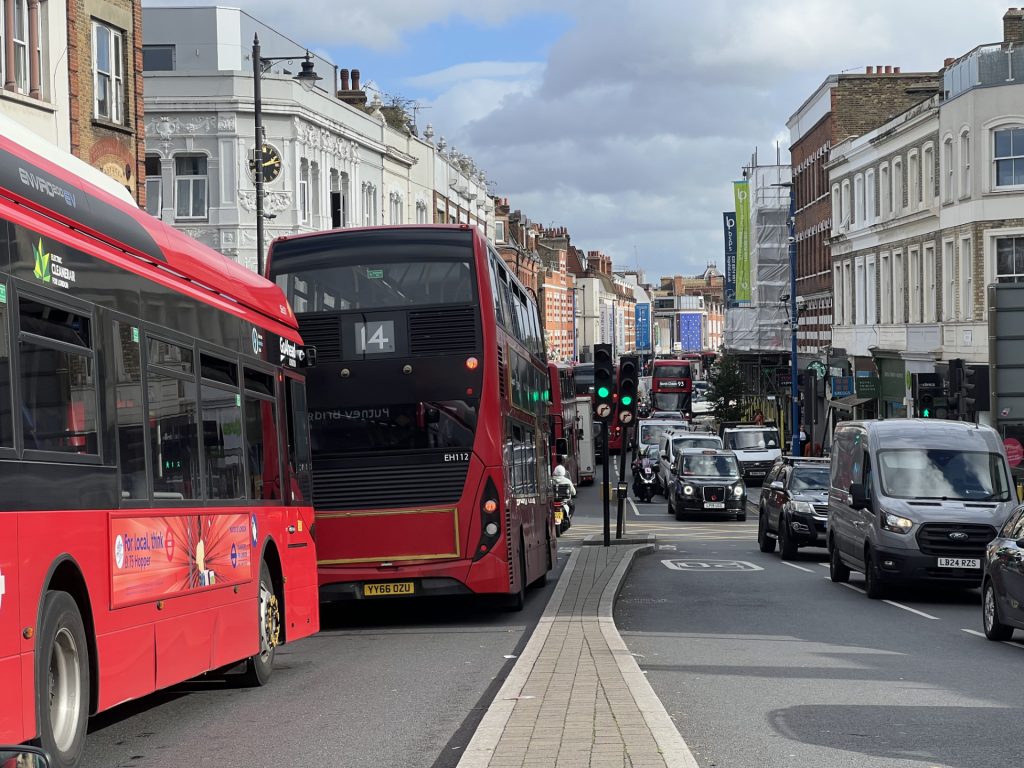
When Putney residents sit in traffic for 30 minutes to travel 500 meters, something has gone seriously wrong. We can reveal the gridlock results from eight overlapping failures – and Hammersmith Bridge isn’t even the main culprit.
Like a perfect storm, each factor alone might be manageable. Together, they’ve created one of London’s worst traffic disasters. We’ve analysed the technical data, studied the traffic flows, and identified exactly why Putney is paralysed. And why quick fixes keep failing.
Cause 1: The signal timing catastrophe
The technical failure everyone suspected – now proven
Signal timings implemented at Putney’s junctions don’t match what Transport for London (TfL) approved. During morning peak hours, Lower Richmond Road lost 10 seconds of green time for its left turn and four seconds for its right turn. Putney Bridge Road lost a devastating 21 seconds. This is per cycle.
Meanwhile, Putney High Street northbound and Putney Bridge southbound gained nine and eight seconds respectively. During evening peak, the pattern repeated: Lower Richmond Road lost 12 seconds for its left turn, while Putney High Street gained time.
The real-world impact
Twenty-one seconds of lost green time means 10 to 15 fewer cars can pass through each signal cycle. Over an hour, that’s 150 to 225 fewer vehicles, creating cascading backups that reach Roehampton.
AECOM’s post-implementation review confirmed what residents witnessed: “Observed signal operation has changed from the proposed model.” The consultants who designed the junction discovered their approved timings were never actually implemented.
Cause 2: The 27-minute bus blockage
When driver changes become traffic disasters
On July 2, 2025, during the morning peak, a bus remained stopped at Putney Pier for 27 minutes – from 8:15 to 8:42am – for a driver changeover. Not a mechanical failure. Not a passenger emergency. A scheduled changeover that paralysed traffic for nearly half an hour.
Between 9 and 10am that same day, buses at Putney Exchange stopped for a combined 31 minutes due to multiple driver changes. The narrow carriageway means when a bus stops, general traffic cannot pass. Heavy vehicles must encroach into the opposing lane, blocking traffic in both directions.
The operational choice
TfL schedules driver changes at these locations despite knowing the impact. The council has requested depot-based changeovers. TfL has not implemented them. Every day, scheduled administrative tasks create 20 to 30 minutes of preventable gridlock during peak hours.
This isn’t infrastructure failure. It’s operational policy creating traffic chaos.

Cause 3: The cycle gate friction
Good intentions, poor results
The junction redesign included a “cycle gate” on Putney High Street: a segregated cycle lane that leads to an advanced stop line, giving cyclists a five-second head start before general traffic gets a green light. The idea is that cyclists clear the junction before cars and buses arrive, reducing potential conflicts and accidents.
But here’s the problem: that five-second head start has to come from somewhere. Every signal cycle includes time for the cycle gate phase, whether cyclists are present or not. Five seconds per cycle, multiplied across hundreds of cycles daily, reduces overall junction capacity by approximately 8 to 12 percent.
The junction also included a dedicated right-turn lane for cyclists wanting to access Felsham Road – designed based on assumptions about cyclist behaviour. Video analysis reveals it’s barely used. Cyclists instead wait at the pedestrian crossing, then use the pavement to reach Felsham Road.
The council built infrastructure based on what they thought cyclists would want, consuming signal time and junction capacity for facilities that don’t match how real cyclists actually behave. The delays are real. The benefits remain theoretical.
Cause 4: The pedestrian crossing complexity
Fewer stages doesn’t mean better flow
The redesigned junction replaced the old multi-stage pedestrian crossings with a new system requiring pedestrians to cross in stages using larger islands in the middle. On paper this sounded simpler. In practice, it created longer wait times and worse coordination.
AECOM observed “high variability” in crossing delays depending on arrival time and which signal stage was running. Some pedestrians now wait over 90 seconds to start crossing -leading to dangerous jaywalking as frustrated people cross against red signals.
The timing of pedestrian crossing lights received heavy criticism in the consultation. Residents reported the changes made crossing “more difficult in certain locations” despite the theoretical improvement. The complexity of coordinating seven different pedestrian crossings across two junctions means pedestrians frequently encounter red lights even when no traffic is moving.
The unintended consequence
Longer pedestrian crossing phases reduce green time available for vehicles, but the actual pedestrian experience hasn’t improved. It’s the worst of both worlds – reduced capacity without enhanced safety or convenience.

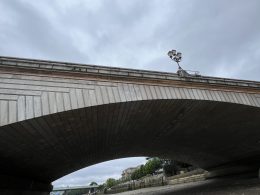
Cause 5: The Hammersmith Bridge paradox
The excuse that hides a darker truth
Here’s what Wandsworth Council and residents have been told: Hammersmith Bridge’s closure since April 2019 forced massive traffic displacement onto Putney Bridge, overwhelming the junction.
Here’s what the data actually shows: In 2018, when Hammersmith Bridge was fully operational, Putney Bridge carried 42,498 vehicles per day. In 2024, with Hammersmith Bridge closed for five years, Putney Bridge carried 37,313 vehicles per day: nearly 5,000 fewer vehicles.
Traffic volumes on Putney Bridge have not returned to pre-pandemic levels, let alone exceeded them. The Department for Transport data is unambiguous: Putney currently handles less traffic than it did before Hammersmith Bridge closed.
But where did those 5,000 vehicles go?
This is where the numbers hide human reality. Some traffic diverted to other bridges. Some shifted to different times. But a significant portion represents journeys people have simply given up making.
Residents who once popped across to Hammersmith for shopping now don’t bother. Families who visited relatives across the river now see them less often. Small businesses that relied on customers from both sides of the Thames have lost trade. Ambulances go to Kingston rather than Charing Cross. The crossing that once took five minutes now takes 30 – so people just stop trying.
Transport planners call this “demand management” and celebrate the reduced vehicle numbers. But they’re measuring surrender, not success. The congestion made crossing the river so miserable that people changed their lives to avoid it.
The modeling deception
The council’s modelling for the junction redesign used July 2021 data – collected after Hammersmith Bridge closure. The models assumed Hammersmith Bridge would reopen by 2026. But the council has now acknowledged that traffic volumes were actually lower in 2024 than in 2018.
So yes, Hammersmith Bridge’s closure matters enormously, for bus routes that can no longer run, for communities cut off from each other, for the slow strangling of cross-river connections that once defined southwest London life.
But blaming it for Putney’s gridlock contradicts the traffic data. The excuse doesn’t match the numbers. And the “success story” of reduced traffic volumes masks the reality of thousands of journeys people can no longer make without their lives becoming demonstrably worse.
Cause 6: The Clean Air neighbourhood squeeze
Displacement from Hammersmith & Fulham
Wandsworth Bridge traffic tells the real displacement story. In 2018, Wandsworth Bridge carried approximately 48,000 vehicles daily. By 2024, that dropped to 37,000: a reduction of 11,000 vehicles.
Where did they go? Hammersmith & Fulham’s Clean Air Neighbourhoods in South Fulham (July 2020) and Southwest Fulham (December 2022) prevented vehicular through-traffic east and west of Wandsworth Bridge. Through-traffic now must use Wandsworth Bridge Road or other crossings.
Some of that displaced traffic affects Putney, though the Wandsworth Bridge data shows overall volume decreases rather than increases. The Clean Air Neighbourhoods changed traffic patterns, but they didn’t flood Putney with tens of thousands of additional vehicles.
Cause 7: The geometry constraints nobody mentions
The unfixable problem
Putney High Street near the junction is narrow. It was originally built for Victorian-era traffic. When a bus stops at Putney Exchange, there isn’t enough room for other vehicles to squeeze past. Large vehicles must swing into the oncoming traffic lane to get around, blocking both directions.
This is a physical constraint that no amount of signal optimisation can fix. The junction’s geometry limits capacity regardless of how cleverly engineers program the traffic lights.
Previous designs proposed lane reductions to create protected cycle lanes. TfL’s modeling showed this would cause “northbound queue completely filling Putney High Street and into Putney Hill during the morning peak.” The physics of the space created impossible tradeoffs.
The honest conversation nobody wants
Victorian streets cannot handle modern traffic volumes without serious tradeoffs. Either traffic flow suffers, or cyclist and pedestrian space suffers, or both suffer somewhat. No magic redesign eliminates geometry constraints.
Cause 8: The synchronization failure
When signals fight each other
AECOM’s analysis revealed wasted green light time between Lacy Road and Putney Bridge Road: empty gaps where signals showed green but no vehicles moved through. The traffic lights aren’t properly coordinated with each other, creating these pockets of wasted time.
When lights aren’t synchronised, you get green lights with no cars, while queues build up elsewhere. “This results in empty gaps further downstream,” AECOM noted, showing wasted capacity between junctions.
The traffic lights need to work together across the entire Putney High Street corridor from the A205 to Putney Bridge. Currently, each junction operates somewhat independently, creating the stop-start pattern that maximises congestion and pollution while minimising traffic flow.
The Perfect Storm effect
Why fixing one thing doesn’t work
Each cause alone might reduce capacity by 10 to 15 percent – annoying but manageable. The disaster comes from how they interact:
Signal timing errors reduce available green time. Bus driver changeovers block lanes during that reduced time. Cycle gates consume seconds from already-shortened phases. Pedestrian crossing complexity extends cycle times. Geometry constraints limit physical capacity. Poor synchronisation wastes what little capacity remains.
The mathematical effect isn’t additive, it’s multiplicative. Eight causes each reducing capacity by 10 to 15 percent create near-total breakdown because each magnifies the others.
This explains why October’s signal timing adjustments – adding 6 seconds to Lower Richmond Road during morning peak – haven’t solved the gridlock. Fixing one of eight interacting problems can’t overcome the compound effect of the remaining seven.
What would actually help
Solutions require facing reality
Immediate priority: Fix the signal timings to match what TfL already approved. This is TfL’s responsibility and doesn’t require new approvals – just implementing what they already signed off on.
Move bus driver changeovers off-street. Use depot facilities or off-street locations. This single change could reduce delays by 20 to 30 percent.
Short-term improvements
Simplify pedestrian crossings to reduce signal phase complexity. The two-stage crossings aren’t working as intended: acknowledge the failure and redesign based on actual pedestrian behaviour rather than theoretical models.
If cyclists aren’t using the dedicated cycle lane with early-start signal that frequently – and video evidence suggests they’re not – then remove it. A safety feature that sits mostly unused doesn’t improve safety. It just wastes junction capacity that could reduce everyone’s delays.
Medium-term solutions
Coordinate all the traffic lights across the entire Putney High Street corridor so they work together instead of fighting each other. This would eliminate the wasted green time and improve traffic flow.
Establish clear accountability: one organisation must take responsibility for junction performance. The current split between TfL and Wandsworth Council enables blame-shifting while preventing effective problem-solving.
Long-term realities
Accept that Cause 7 (geometry constraints) limits what’s physically possible. Victorian streets cannot handle modern traffic volumes without tradeoffs.
Either reduce traffic volumes through genuine alternatives, or acknowledge that congestion will persist and plan accordingly. Or, dare we say it, come up with a genuine forward-looking and innovative solution and drive it forward.
The Hard Truth
Eight causes. Two authorities. Zero accountability.
The data reveals Putney’s gridlock isn’t fate or Hammersmith Bridge, it’s failure. Technical errors in signal implementation. Operational decisions prioritising bus drivers over public flow. Design elements that sound beneficial but deliver poor results. Physical constraints everyone ignores. Coordination failures across organisational boundaries.
Until someone takes responsibility for all eight causes – not just the convenient ones to blame on others – Putney remains paralysed.
Thursday’s Transport Overview and Scrutiny Committee meeting will show whether authorities finally grasp the full picture, or whether they continue playing blame games while residents sit in traffic watching their lives drain away 30 minutes at a time.
The choice is theirs. The consequences are ours.


Brillant article –
They have had a year an no improvement so they don’t care really
Felsham road is a race track with schools – someone will get killed and they will be to blame
Here’s hoping someone with a brain now will read it and do something to fix.Their mess and stop having meeting about meeting and blaming each other and sorted it out.
Thank you for your article it’s brillant
No! If someone gets killed the fault will not be with those you criticise for making no improvement (presumably you mean WBC and TfL?) but wuth the headless, impatient driver of the vehicle that killed.
Excellent analysis. The root cause, despite lower traffic volumes on both Putney and Wandsworth bridges is still too many vehicles on roads that can’t cope. Whatever changes are made to PHS will not address that – action at government level is needed.
Radical solutions such as road pricing need to be considered – fewer vehicles means more room for buses and a better chance they could a) run on time and b) be made more frequent. For now, and for the foreseeable future, our politicians are unlikely to grasp this particular nettle. But the status quo is not sustainable.
Road pricing would help in cities generally but, in this case, the Putney junctions were coping much better before the changes, as the article patiently explains
Great analysis.
Many thanks for all your efforts in reporting on this vital issue, using accurate data and conducting a proper investigation.
Has anyone in these task forces looked at leveraging real time data from providers such as Google/Waze to dynamically regulate the traffic signals across the area, all the way to Hammersmith, Barnes and Wandsworth?
Best
Discussing closure of Hammersmith Bridge,
you say that “the ‘success story’ of reduced traffic volumes masks the reality of thousands of journeys people can no longer make without their lives becoming demonstrably worse,” but many of these journeys will either go over different bridges or not take place at all because they weren’t really necessary in the first place: that’s the nature of traffic evaporation.
And none of this helped by the sort of thing I experience yesterday. Upper Richmond Road was absolutely gridlocked because of road works on Clifford Avenue, blocking one side of the road. When major congestion like this is caused, even if for perfectly understandable reasons, why was no work going on? It was of course a Sunday, but as our society now operates on a 7 day, 24 hour basis, is it too much to ask that the work continues throughout the weekend as well, so that congestion is kept to a minimum? This has happened in Clifford Avenue on several occasions and it is not just weekends which see the disappearance of any sign of activity. Any activity after 4pm on a weekday appears to cease.
Thank you for all this information, for your determination and for revealing the TRUTH about the mess that no one is managing! Another serious concern for residents not being addressed is emergency access on gridlocked side roads (often at weekends). It would be impossible for any to get through stationary traffic, in part because we have particularly narrow streets that even with 2-way traffic doesn’t allow in reality, so no car could give way. I have written to the council about this with photo evidence, but have heard nothing in response. Our MP replied to the same concern but provided no solution bar the generic council reply letter sent to all local residents. I want names of who would be held responsible if the worst was to happen.
A great and well researched article on this, finally. One thing you could also mention is that the traffic on Lower Richmond Road has been made unnecessarily worse by reducing the flow from tow to one lane turning left onto Putney Bridge. It didn’t help regulate the flow as there was never much traffic going north from that point and it has just meant longer waits on that road, plus signals have had to stay green from that direction longer, causing further delays elsewhere.
If you are writing a follow up, it would be interesting to survey some of the local businesses and find out if the (presumably) fewer customers from north of the river have been balanced by more from the immediate locality, who have been discouraged from going the other way, or if there’s been an overall reduction, as I’ve heard?
Vehicles turning left from Lower Richmond Road into Putney High Street seem to think that the left hand lane is a bus lane, which it isn’t, and immediately try to merge with the traffic in the right hand lane. In doing so, they block the left hand lane, preventing vehicles coming from Putney Hill from clearing the box junction. As a bus driver I often have to wait for multiple light changes in order to cross the box junction. Often there are 4 bus lengths of empty tarmac in the left hand lane.
As for driver changes, depot changes would mean that all passengers would have to alight from the bus so the bus could drive into the depot (and then queue in Chelverton Road to get back out. I would also be interested to know where these “off street locations” could be. I can’t think of any suitable for the 14 routes.