Police will tell a public meeting tonight that violence in Wandsworth has fallen sharply. The Met’s own published figures show it has gone up.
From April to August this year, violence in the borough was 5% higher than in the same months of 2025. Over the full year to August it was up 8%. In West Putney it has risen by a third: 310 violent offences in the past 12 months, against 235 the year before.
West Putney residents have asked their police team what is driving that rise at every ward panel since March. They have still not been told.
Several wards see more violence for their size, including Roehampton and Wandsworth Town. But West Putney is the only Putney ward where it has climbed by more than the normal ups and downs, and the rise held all summer: 31, 26, 33 and 27 offences a month from May to August.
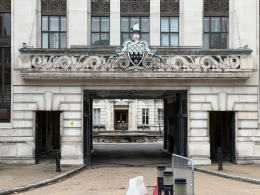
The Met’s claim that violence has dropped will be heard at the Safer Neighbourhood Board, which meets tonight at Town Hall. A presentation has been provided in advance and one slide in the borough’s neighbourhood policing update, headed “Improving in Q2”, lists falls in eight types of crime. Under it: “Strong reduction in Violence, Robbery, Burglary and Retail Crime.”
None of the report’s tables includes violence. The comparison the slide does make sets a second quarter running from 1 July to 16 September, 78 days, against a first quarter of 91 days. A period that is 13 days shorter will show about 14% fewer crimes even if nothing changes.
If you calculate crime instead on a per-day basis, most of the claimed fall goes. Burglary and hate crime are flat, anti-social behaviour is down 4%, and theft from vehicles nearly doubled. Robbery and shoplifting did fall.
The Met’s published figures for violence run to the end of August, and they show no fall at all: about 22 violent offences a day in Wandsworth from April to June, and 23 a day in July and August.
“Strong reduction in Violence, Robbery, Burglary and Retail Crime.”
No violence figures appear in any table in the report.
22 violent offences a day, April to June
23 a day, July and August
+5% April to August, against the same months of 2025
Over the full year, the borough recorded 7,724 violent offences, the most in six years. Violence rose in 13 of its 22 wards, and fell in one.
How the figures move
Police often say crime figures go up and down. They do. A ward averaging 23 violent offences a month will see some months in the low teens and others in the thirties for no particular reason. In West Putney, 59 of the past 72 months sit inside that range. One bad month proves nothing, and nor does one good month: in June, figures for the spring suggested violence had halved, and the summer put it back up.
The best way to understand if the crime figures show more than normal variance is to add up a whole year and set it against the year before, which is why the police often compare the latest figures with those a year before.
There is a simple test for whether a change is bigger than chance. The natural wobble in a count is roughly its square root. Two years with 310 and 235 offences between them wobble by about 23, and West Putney’s rise of 75 is more than three times that. Across Wandsworth, the rise of 581 offences is nearly five times its wobble. A change twice the wobble is very unlikely to be chance.
Last year was West Putney’s quietest in six, so part of the rise is a return from an unusually low point. But this year’s 310 is the second highest of the six, behind only the year to August 2022, when there were 337.
Another common explanation is that more people report crime when officers focus on it. At the June panel, asked to account for rises in violence and drugs, the ward’s lead officer, PC Ben Walters, offered his own: “We caught more people, and we had a good summer.” No operation was named and no figures were given.
“Violence against the person”, the category behind all these numbers, covers four kinds of offence. Violence with injury means assaults causing actual or grievous bodily harm, wounding and attempted murder. Violence without injury covers common assault, threats to kill and assaults on police and emergency workers. Stalking and harassment covers repeated unwanted behaviour, including controlling behaviour within a relationship and threatening or grossly offensive messages; a whole course of conduct counts as one crime. The fourth is homicide. Sexual offences are counted separately.
Across Wandsworth, the rise is mostly stalking and harassment, up 20%, and violence without injury, up 6%. Violence with injury has not moved beyond its normal range.
Most of West Putney’s rise is violence without injury, up from 102 offences to 140, the highest in six years. Stalking and harassment rose from 68 to 90 and violence with injury from 64 to 79. There were no homicides in either year.
What the figures cannot show is who is involved or why. In March, officers suggested domestic abuse might be behind the rise. The published figures have no way to separate it out.
Asked, and still not answered
Residents first raised the rise in March, at the ward panel at Granard Primary School on Cortis Road. PC Kevin Wakefield told them the team had not been aware of it. “We haven’t seen, we haven’t noticed anything. I would have said it’s actually safe here,” he said. Officers said they were given figures only for the ward’s three policing priorities, and would find out and report back.
At the next panel, on 30 June, residents asked again. “You tell me,” PC Walters said. A fuller analysis, he said, “would take weeks to do.”
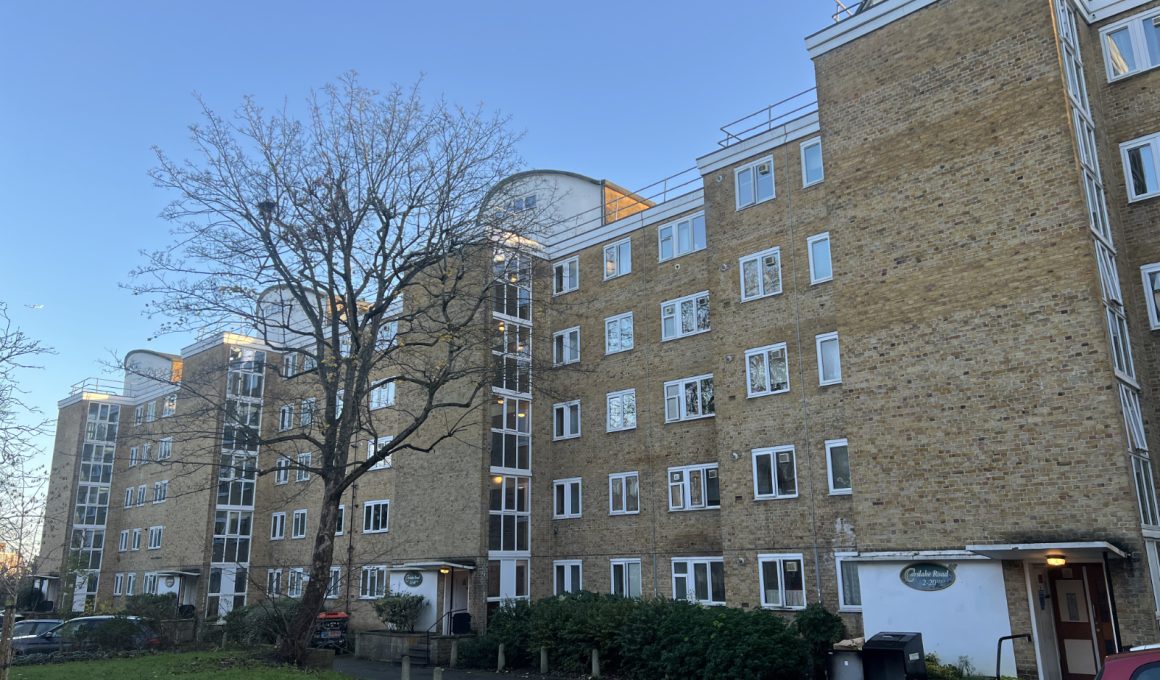
The wording of the ward’s violence priority is the same as in April. It names drug supply and use “in and around the Ashburton Estate”, much of it “specific to Cortis Road area and surrounding parade of shops”. The rise is not confined there: approximate police map data puts about a quarter of the ward’s violent and sexual offences within 300 metres of Cortis Road, this year and last.
Three months after “You tell me”, the panel’s report to tonight’s Board records the same problem. There “remains concern about the ability of the police team to answer questions about the details and reasons behind the data spikes, particularly around violence against the person”. The Board’s own summary puts it more simply: the panel “would value a fuller discussion with local police about what lies behind these figures.”
What you can do
- Watch or attend tonight’s meeting. Wandsworth’s Safer Neighbourhood Board meets at 6.30pm in the Council Chamber, Wandsworth Town Hall, Wandsworth High Street, SW18 2PU, and is webcast. Meeting papers
- Ask at the next ward panel. West Putney’s panel next meets on Tuesday 15 December at 6.30pm, at Granard Primary School, Cortis Road.
- Contact the ward’s police team at westputney@met.police.uk. Report crime on 101, or 999 in an emergency.
- Write to West Putney’s councillors: Shakeel Ahmad (Cllr.S.Ahmad@wandsworth.gov.uk), Nick Austin (cllr.n.austin@wandsworth.gov.uk) and Melanie Hampton (Cllr.M.Hampton@wandsworth.gov.uk).