Wandsworth improved its recycling rate faster than almost any council in England last year, government data shows. It is still one of London’s worst performers.
Government figures published last month show the borough’s household recycling rate rose by 5.1 percentage points in 2024/25, one of only two councils in England to improve by more than 5pp. The other was Cornwall, which gained 7.4 points. Of 321 English councils, 69% saw their recycling rate fall over the same period.
The food waste rollout, which reached most of the borough in 2024, drove most of the improvement. Wandsworth collected an additional 10,000 tonnes of recyclable material over the year.
Still near the bottom of London
The borough’s recycling rate is now 27.9%. That puts it 10th from the bottom among London’s 37 councils, below the London average of 32.6%. London itself is the worst-performing region in England for recycling. The national average is 42%.
The contrast with Richmond upon Thames is stark. Both boroughs run their waste collections through a joint service: the same staff, the same contractor relationships, the same operational infrastructure. Richmond’s recycling rate is 42.6%. Wandsworth’s is 27.9%. The gap is 14.7 percentage points.
Wandsworth household waste recycling rate 2010-11 to 2024-25, compared to Richmond, London average and England average
Wandsworth actually collects more dry recycling (paper, glass, plastic and metal) than Richmond: 22,039 tonnes against 19,030. Residents are not refusing to recycle. The gap is almost entirely organic and garden waste: Richmond collected 11,917 tonnes; Wandsworth collected 4,162 tonnes, less than 35% of Richmond’s volume, despite Wandsworth being the larger borough.
One further figure sharpens the picture. Wandsworth generates 427.7 kg of residual waste per household each year, less than Richmond’s 486 kg. Wandsworth residents produce less rubbish than Richmond residents. They just recycle less of it. The gap is a policy gap, not a behaviour gap.
Richmond has a well-established garden waste scheme. Wandsworth has historically under-invested in this stream. The same staff run both. The difference is what the two councils have chosen to prioritise.
Richmond has been at 40-44% since 2010/11. Wandsworth ranged between 20.4% and 28.4% over the same period, and this year’s 27.9% only just edges past the 2011/12 figure. The council deserves some credit for a significant improvement in the past year, and for partially closing a gap that opened over a decade.
| Wandsworth | Richmond | |
|---|---|---|
| Recycling rate | 27.9% | 42.6% |
| Total household waste | 93,760 tonnes | 72,655 tonnes |
| Sent for recycling | 26,201 tonnes | 30,947 tonnes |
| Dry recycling | 22,039 tonnes | 19,030 tonnes |
| Green/organic waste | 4,162 tonnes | 11,917 tonnes |
| Residual waste per household | 427.7 kg | 486.0 kg |
What the council is telling residents
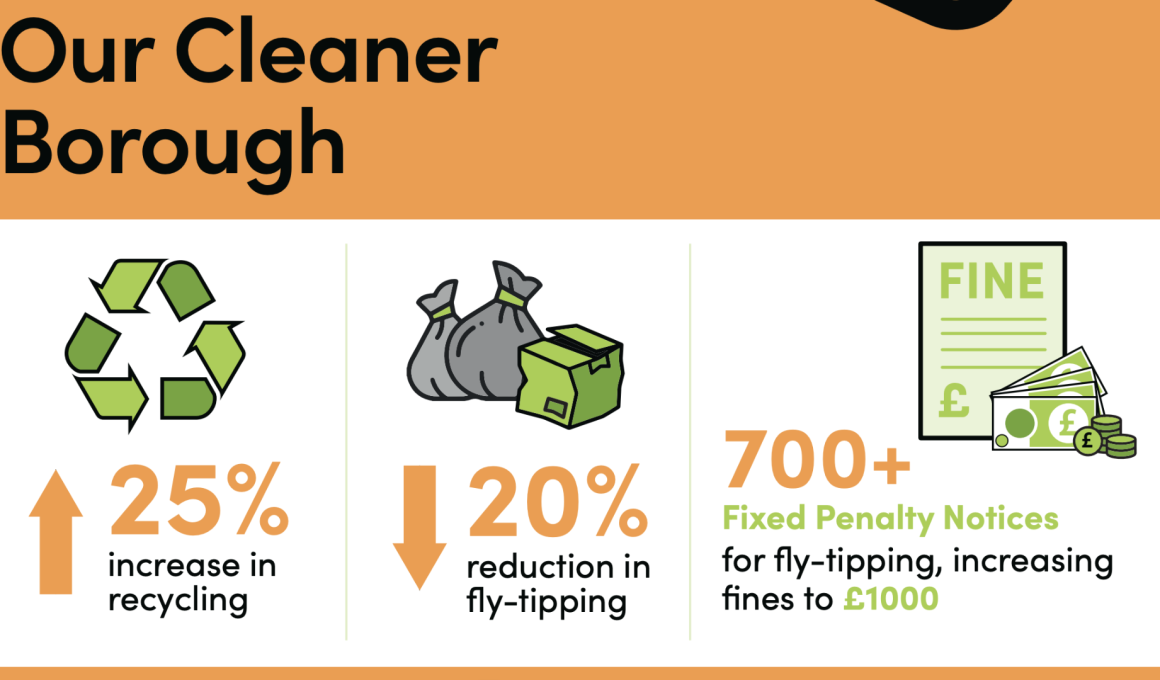
The 5.1 percentage point improvement is genuinely significant. What the council made of it is also notable. Simon Hogg’s letter to every household led with “a 25% improvement in our recycling rate”, the opening substantive claim in a pre-election communication to 159,000 homes.
The same figure appeared in a press release, an infographic, and has been cited at recent hustings as evidence of the council’s green credentials.
The 25% figure is not wrong, exactly. It measures the increase in volume collected rather than the change in recycling rate: a different calculation that produces a more impressive number. Although, we should note, even that bit of data manipulation comes out at 23%, not 25%.
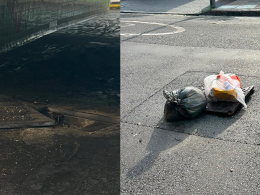
The council’s waste services have had a difficult few years. Our investigation in November found that despite public commitments to “relentlessly pursue” Serco over an 18-month service failure, the council had issued zero formal enforcement notices. Collections hit their lowest recorded levels in summer 2025. Wandsworth spends £22.8 million a year on waste services.
This administration has a tendency to present its achievements in the most favourable possible light, which is not unusual in local government, particularly in an election year. But there are wider issues: a council that talks only in superlatives loses the internal pressure to close the remaining gap. And in recycling, as the Defra data shows, the gap remains considerable.
The direction is right
The 2024/25 improvement is real and bucks a national trend.
The question is pace. At 27.9%, Wandsworth is less than halfway to the government’s 65% recycling target for 2035 with nine years to run. The dry recycling data suggests the capacity is there: residents are already engaged. The missing piece is organic collections. Our analysis from March 2025 identified what has held that back, including around 10,000 flats above shops that are hard to service. This year’s data shows those barriers are not immovable.
Wandsworth’s new Simpler Recycling rules, which came into force at the end of March, added four new material streams. If participation holds, the 2025/26 rate should improve further.

As you’ve said, the difference looks like it predominantly comes from the volume of green/garden waste. Does that not suggest that perhaps there are more/larger private gardens in Richmond &/or more people keen on gardening therefore tidying up & creating more garden waste? I think the more important stat is the residual waste & not only that but the residual waste per household or per person, both of which are v slightly lower in Wands than in Richmond. And if you then look at the change in that measure from 2023/4 to 2024/5, you’ll see that Wandswoth have reduced residual waste per household by 5% & Richmond by 4% (vs no change across total London boroughs) – so I think we’re doing alright!
Have you considered the possibility that Wandsworth residents could be self-recycling garden and organic waste themselves rather than passing it onto the Council?
I live at a block of 48 flats. We recycle all our garden waste to produce compost. We store waste wood and hedge cuttings, dry them out, and have a couple of controlled burns per year, which provide potash for additional fertiliser.
A neighbouring development of 20+ townhouses also has a composting system in place. The same applies to the nearby allotments on the Dover House Estate.
Individual households can purchase an open-bottomed composting bin in their garden for £30-£35 and put garden waste, such as egg-boxes, eggshells, shredded paper, and raw vegetable waste, into it. These composting bins are impossible to keep up with; you can never fill them as the material breaks down so fast with the worm activity at ground level.
I have an elderly friend who uses the Council service whereby they will take away up to 5 bags of compostable garden waste each week. In Autumn he gathers up fallen leaves from his garden into bags and passes them to another friend who uses them for leaf mulch on her allotment at King George’s Park.
See: https://www.wandsworth.gov.uk/rubbish-and-recycling/your-weekly-collections/garden-waste/
Perhaps Wandsworth residents are just better (more eco?) at self-recycling/composting than Richmond residents? It’s certainly a possibility!!
For details of what
A fair point, and self-composting genuinely does divert waste: your block, the townhouses, the allotments are all doing something real. The question is whether it could explain the scale of the gap we’re looking at.
The difference between Wandsworth and Richmond in officially collected organic waste is 7,755 tonnes a year. To make that concrete: a seriously active home composter (someone with a garden, a compost bin, the lot) might divert somewhere between 100 and 150kg of material a year. To close a 7,755-tonne gap through self-composting alone, you’d need somewhere between 52,000 and 78,000 Wandsworth households running active composting setups, every year, consistently. That’s between a third and more than half of every household in the borough, and it would have to be higher than whatever Richmond residents are self-composting, since the same logic applies to them.
Your block of 48 flats, composting actively, accounts for roughly 2.4 tonnes a year. That’s genuinely useful, but at that rate, closing the gap would require 155,000 individual flats or houses doing the same thing. Wandsworth has around 137,000 households in total. You’d need every single one of them composting at your block’s rate, and then some.
Translated into what a council waste operation actually looks like: 7,755 tonnes over a year is roughly an extra 17 lorries on the road every single week, with routes, drivers, processing capacity and collection points to match. That’s the scale of infrastructure Richmond has been running for over a decade. Individual composting is admirable (it genuinely reduces the burden) but it doesn’t replicate that. This is precisely why councils exist: some problems are only solvable at a scale that no collection of individuals, however conscientious, can reach on their own. Seventeen lorries a week, 52 weeks a year, routes planned, drivers rostered, processing facilities contracted: that is not a neighbourhood project. It is infrastructure, and infrastructure is what local government is for.
There is one thing in the data that supports your broader instinct, though. Wandsworth residents produce less total rubbish per household than Richmond residents: 428kg versus 486kg a year. So residents here are not wasteful; the gap isn’t about people generating more. It’s specifically about what gets formally diverted into recycling rather than going to landfill. That’s consistent with some of it going the way you describe. But not 7,755 tonnes worth.
Google says that there are maybe 85,000 households in Richmond compared to 137,000 households in Wandsworth. It thus seems remarkable that Richmond Council can apparently collect so much organic waste?
Are they just counting household organic waste, OR are they including large volumes of material from municipal / public park & green spaces?
If that were the case, Richmond has >2,000 hectares of green space (parks, commons, cemeteries, allotments, woods, etc.). By comparison, Wandsworth has about 670 hectares of green space (parks, commons, cemeteries, allotments, woods, etc).
So we need to understand how both Councils have arrived at the figures they quote, to ensure we are comparing like with like, don’t you think?