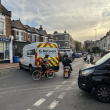
When 763 residents completed our comprehensive survey about Putney Bridge junction, their overall verdict was clear: 90.5% report worse journeys. But beneath that headline consensus lies a more revealing story about why finding a solution has proven elusive.
Cross-tabulating responses by transport mode and awareness levels reveals that different groups aren’t just experiencing different severity of impact – they hold different theories about what went wrong and how to fix it. The challenge isn’t just technical; it’s that there’s limited consensus on what the actual problem is.
Different modes, different priorities: competing theories of failure
When asked what actions they’d most like to see, distinct patterns emerged across transport modes – revealing that different groups hold fundamentally different theories about what went wrong.
Cyclists prioritise fixing the implementation:
- 56.9% want to focus on fixing signal timing and monitoring results
- 45.1% want to revisit whether better designs are now possible
Bus users and car drivers prioritise reconsidering the design:
- Bus users: 55.6% want to revisit designs, 38.1% want signal fixes
- Car drivers: 54.2% want to revisit designs, 39.5% want signal fixes
The gap is substantial: A 15-17 percentage point difference in priorities between cyclists and drivers/bus users.
Pedestrians fall in between, with a slight preference for signal fixes (49.2%) over redesign (43.1%). Those who use multiple modes of transport equally – the largest single group at 36% of respondents – align more closely with drivers and bus users, prioritizing redesign (54.0%) over signal fixes (40.5%).
This pattern reveals something fundamental: cyclists appear more likely to believe the current design could work if properly implemented, while drivers and bus users appear more likely to believe the fundamental design is flawed.
This isn’t just about preference – it reflects lived experience. Cyclists using the junction may see a design that could be functional with better signal timing. Drivers and bus passengers sitting in extended queues may be experiencing problems they view as inherent to the layout itself.
The result: even among residents who agree the junction has failed, there’s no consensus on whether the problem is implementation or conception. That makes finding a solution that satisfies multiple constituencies a challenge.
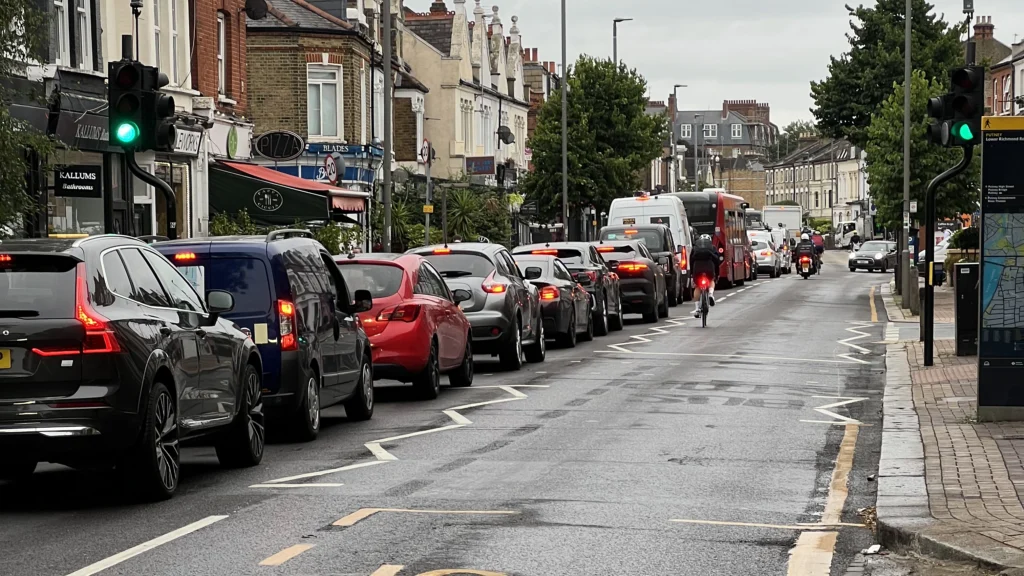
Why they disagree: Journey impact varies widely
The reason different transport modes want different solutions becomes clear when examining the severity of impact each group experiences.
Percentage reporting worse journeys (much worse + somewhat worse):
| Transport Mode | % Worse Journeys |
|---|---|
| Car drivers | 97.2% |
| Bus users | 93.7% |
| Mixed mode users | 93.4% |
| Pedestrians | 80.0% |
| Cyclists | 72.5% |
The gap is substantial: a 24.7 percentage point difference between cyclists and car drivers in overall dissatisfaction. Also notable is the “much worse” breakdown:
| Transport Mode | % “Much Worse” |
|---|---|
| Car drivers | 90.4% |
| Bus users | 88.9% |
| Mixed mode | 84.3% |
| Pedestrians | 60.8% |
| Cyclists | 56.9% |
The pattern explains the solution divide. Cyclists experiencing a 73% dissatisfaction rate are more likely to see signal timing as the culprit – something fixable through better implementation. Drivers experiencing a 97% dissatisfaction rate, with 90% saying “much worse,” are more likely to see the problem as fundamental to the design.
Notably, bus users – the group theoretically benefiting from dedicated bus lanes – report 93.7% worse journeys. This high dissatisfaction rate among a group that “should” be benefiting suggests the problems extend beyond any single design element.
Among cyclists, while 72.5% report worse journeys, they were also the only group where more than a handful saw improvement. This doesn’t mean the design “worked” for cyclists – nearly three-quarters still report worse conditions – but it does suggest the experience is less uniformly negative than for other modes.
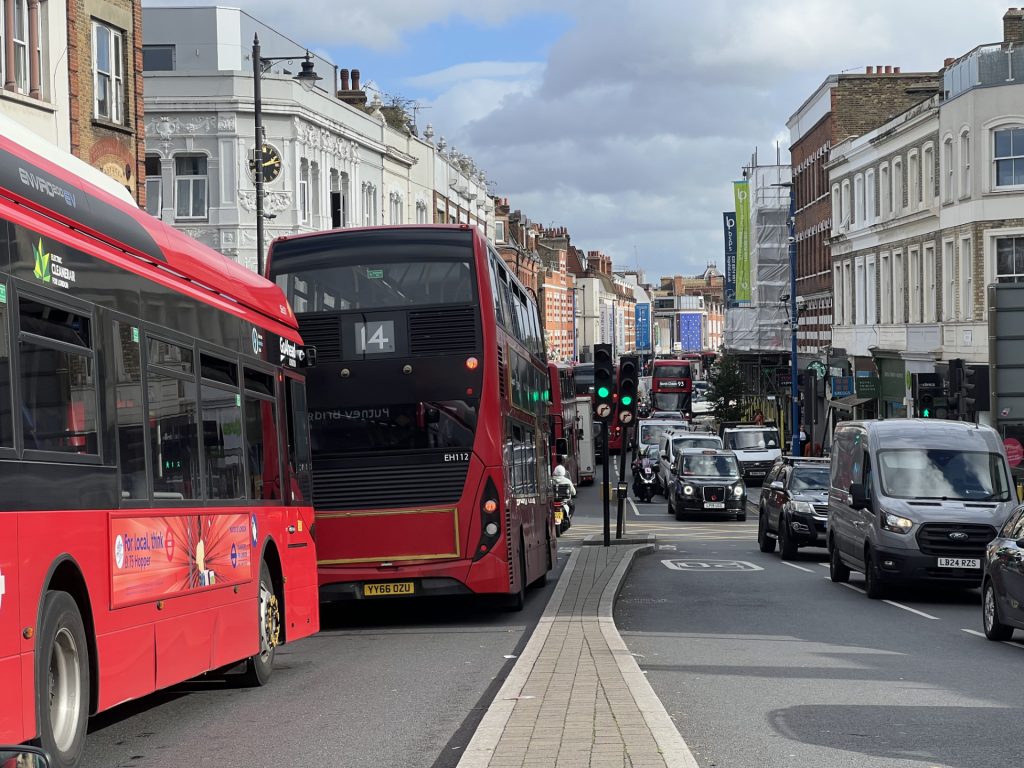
Consultation views: A revealing split
The question of whether the council should have conducted broader public consultation before construction revealed a significant pattern across transport modes.
Percentage saying no consultation was “unacceptable”:
- Car drivers: 87.0%
- Bus users: 84.1%
- Mixed mode: 77.7%
- Pedestrians: 76.2%
- Cyclists: 72.5%
The gap is meaningful: A 14.5 percentage point difference between car drivers and cyclists in viewing the consultation absence as unacceptable.
While nearly three-quarters of cyclists still found the lack of consultation unacceptable, they were notably less upset than other groups. Cyclists were also the most likely to view it as “reasonable” that technical projects don’t need public input (17.6% vs 5-11% for other groups).
This may reflect several factors: greater trust in technical experts to design cycling infrastructure, recognition that public consultation on cycling infrastructure often generates significant opposition, or different baseline expectations about community engagement on transport projects.
Conversely, car drivers expressed the strongest view that residents should have been consulted (87.0%), perhaps reflecting lived experience of feeling that changes were “done to them” without their input.
The pattern reinforces the broader finding: different transport modes bring different expectations and experiences to this project, making unified support for any solution challenging.
The CYCLOPS blind spot: Even cyclists didn’t know
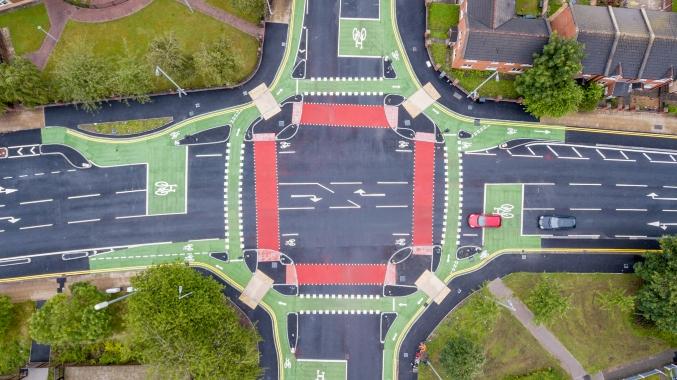
An important finding concerns awareness of TfL’s rejection of a safer CYCLOPS design for cyclists.
Even among people who primarily cycle through Putney, 90.2% were unaware this design option existed. Just 5.9% of cyclists knew about it, with another 3.9% having heard rumors.
This is notable. CYCLOPS (Cycle Optimised Protected Signals) junctions are specifically designed to protect cyclists at major intersections. If any group might be expected to know about this design decision, it would be the cyclists themselves – the people most directly affected by junction safety.
The awareness levels across other transport modes were similarly low:
- Mixed mode users: 92.3% unaware
- Car drivers: 89.8% unaware
- Pedestrians: 87.7% unaware
- Bus users: 82.5% unaware
This near-universal lack of awareness across all transport modes provides clear evidence of a fundamental communication failure. The rejection of the CYCLOPS design was not a fringe technical detail – it was a central decision about the junction’s character and cyclist safety. Yet it appears to have been made without meaningful public awareness or discussion.
Knowledge and blame: The Cyclops awareness effect
A revealing pattern emerges when examining how CYCLOPS awareness correlates with views on accountability and TfL’s role.
Among those who knew about the CYCLOPS rejection:
- 30.6% support TfL’s veto power without qualification
- 33.3% say shared responsibility for the signal failures
- 19.4% primarily blame the council
Among those unaware of CYCLOPS:
- 10.2% support TfL’s veto power without qualification
- 48.6% say shared responsibility
- 24.2% primarily blame the council
People who knew about the CYCLOPS rejection are three times more likely to support TfL’s veto power. They’re also less likely to say “everyone is responsible” and more willing to assign specific blame to individual parties.
This suggests that detailed knowledge of what happened leads to more differentiated views. Those who understand TfL rejected a safer cycling design are more likely to view TfL’s role in the strategic road network as legitimate. Those without this context are more likely to see a general failure of governance.
What this means for Thursday’s committee meeting
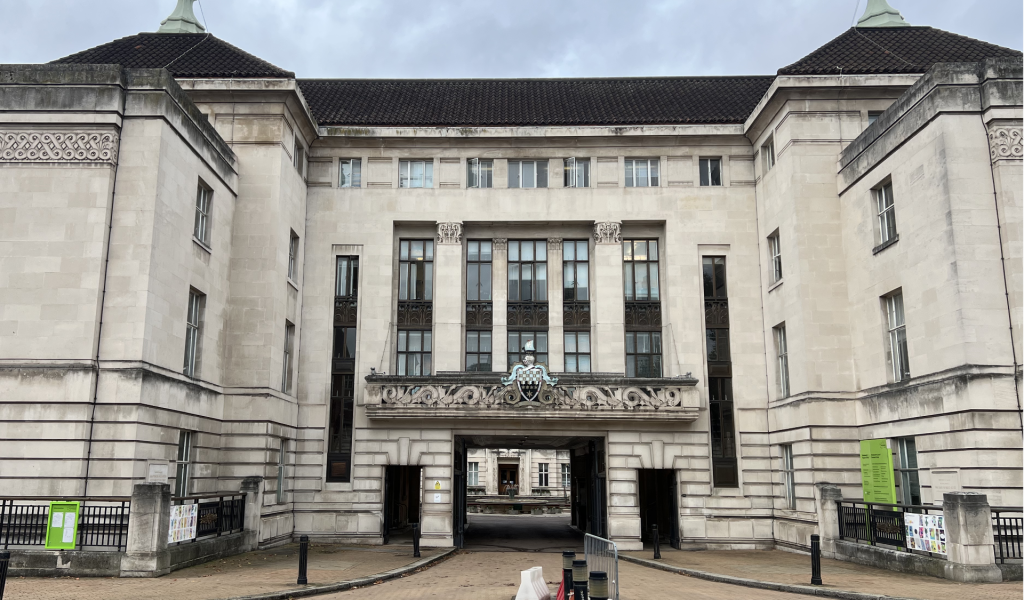
These crosstab findings reveal why solving Putney’s junction problem is so challenging: it’s not simply a technical failure that needs fixing – it’s a situation where different communities are experiencing different problems and hold competing theories about what went wrong.
Different transport modes want different solutions because they’re experiencing different severity of impact. Cyclists facing a 73% dissatisfaction rate are more likely to see signal timing as fixable. Drivers experiencing 97% dissatisfaction, with nine in ten saying “much worse,” view the problems as fundamental to the design. Both perspectives reflect genuine lived experience.
The communication failure was significant. When 90% of cyclists – the group most affected by safety design decisions – don’t know TfL rejected a safer CYCLOPS junction, the decision-making process has clearly failed. This wasn’t a minor technical detail; it was a central choice about the junction’s character.
Knowledge creates nuance, not opposition. The finding that residents who knew about CYCLOPS are three times more supportive of TfL’s veto power is counterintuitive but important. Detailed understanding of what happened doesn’t create unified opposition – it leads to more sophisticated, differentiated views about governance and accountability. Those without this context are more likely to see simply “general failure” rather than specific institutional decisions and trade-offs.
The 14.5 percentage point gap in consultation anger between cyclists and drivers reflects different relationships with the transport planning process. Cyclists may have more faith that technical experts will protect their interests; drivers feel changes were imposed without their input. Both views are legitimate and help explain why building consensus is difficult.
For the Transport Overview and Scrutiny Committee meeting on Thursday, these patterns suggest several implications:
- There may not be one “fix.” Different communities are experiencing different problems and want different solutions. The committee may need to pursue multiple parallel approaches: immediate signal optimization for some groups, strategic design review for others.
- Communication infrastructure needs rethinking. If 89% of residents – including 90% of those most affected by safety decisions – were unaware of a central design choice, standard consultation methods have clearly failed. Future projects need new approaches to community awareness.
- Different stakeholders need different engagement. What reassures cyclists may not address bus users’ concerns. Solutions need to acknowledge that this junction serves multiple communities with legitimately different needs and perspectives.
- Transparency builds sophisticated understanding. The more people know about specific technical decisions and trade-offs, the more nuanced their views become. Moving from 89% unaware to meaningful community engagement requires much more than newsletters – it requires embedding residents in decision-making from the start.
The fundamental challenge: even among residents who overwhelmingly agree the junction has failed (90.5%), there’s no consensus on whether the problem was implementation or design, whether it’s primarily the council’s or TfL’s responsibility, or what the path forward should be. That disagreement reflects real differences in lived experience, not mere opinion. Finding solutions will require acknowledging these differences rather than pretending they don’t exist.
Statistical note on sample reliability
With 763 responses from a population estimated at approximately 15,000 regular junction users, this survey achieves a margin of error of ±3.5% at 95% confidence level. This means we can be 95% confident that the true population values fall within 3.5 percentage points of the reported figures.
For context: if the true proportion of residents who find journeys worse is 90.5% (as found), we can be 95% confident the actual population value lies between 87% and 94%.
The sample size is more than sufficient for robust conclusions about overall resident sentiment, though care should be taken when examining smaller subgroups (such as the 51 cyclists, where margins of error are larger).
The survey was conducted November 16-18, 2025, with 763 complete responses.
The survey results are available upon request.


