Figures just released by Transport for London (TfL) have revealed which buses in Putney run the fastest and slowest – and the results may be surprising.
The fastest Putney bus is the 265, running at an average of 12.5 miles per hour – a fact that is likely to be met with raised eyebrows given that the bus is best known for being Putney’s “ghost bus” due to the number of times it simply fails to turn up.
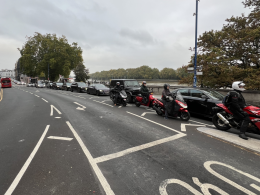
The top speed is also surprising given that the 265 travels from Putney Bridge along Lower Richmond Road – a notoriously slow route thanks to traffic from Barnes due to the continued closure of the Hammersmith Bridge.
But wait. The answer lies in the fact that this is an average speed figure and the 265 goes all the way to Tolworth with most of its route on the A3 main road, turning it from a slog to a greyhound – so long as you ride it all the way to the end.
Also near the top of average speed is another bus that has a nasty habit of not turning up – the 485 – which heads from Wandsworth Town across Putney into Barnes. It seems the less a bus appears and the least amount of time a bus speeds on Putney High Street, the faster it is.
But of course the bigger question is: what is the slowest bus in Putney?
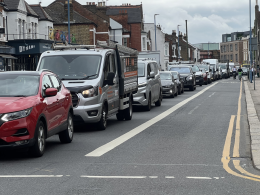
It will surprise no one to learn that it’s the Number 14 which starts its interminable journey at Putney Heath before heading down the Putney Traffic Jam aka Putney High Street, and through Chelsea ending up in Bloomsbury Square at a miserable average of just 6 miles per hour.
You can check out all the buses that pass through Putney at the bottom of this story. But of broader interest is how London buses compare to comparable cities across the world.
Comparison to other cities

According to a different set of data London is doing great at being green with the lowest CO2 emissions in the world when compared to New York, Paris, Singapore and another 10 global cities.
It won’t come as a surprise Londoners to know that the bus network also excels at another thing: making money. The capital came third in the list of 13 cities when it comes to commercial income.
What is more concerning though is London has one of the slowest bus networks – and is getting slower each year – while also being one of the most dangerous: 10th when it comes to the number of collisions per kilometre.
So there you have it: London buses are slow, expensive and dangerous – but green.
Putney bus speeds – slowest to fastest
| Bus line | Average Speed |
| 14 | 6.0 |
| 424 | 6.7 |
| 220 | 7.4 |
| 74 | 7.6 |
| 670 | 7.8 |
| 639 | 8.1 |
| 37 | 8.3 |
| 430 | 8.3 |
| 270 | 8.4 |
| 337 | 8.8 |
| 170 | 9.0 |
| 39 | 9.1 |
| 156 | 9.1 |
| 93 | 9.2 |
| 493 | 9.5 |
| 85 | 10.3 |
| 485 | 11.0 |
| 378 | 11.2 |
| 265 | 12.5 |
| N22 | 14.2 |
| N72 | 15.9 |
| N33 | 17.8 |