Wandsworth Council’s Annual Air Quality Status Report for 2024 [pdf], recently published*, confirms that air pollution levels across the borough continue their downward trajectory, with Putney High Street showing particularly strong improvements. However, the report also highlights that despite meeting UK legal standards, concentrations remain well above World Health Organisation guidelines.
The report contains encouraging news for Putney. The key monitoring site at Putney High Street (site W24, located at McDonald’s) recorded an annual mean nitrogen dioxide (NO₂) concentration of 34 μg/m³ in 2024 – a decrease of 4 μg/m³ from 2023’s 38 μg/m³.
This represents the sixth consecutive year of decline and marks a dramatic 38.2% reduction since 2018, when the site recorded 55 μg/m³. More significantly, 2024 marks the second consecutive year that Putney High Street has met the UK National Air Quality Objective of 40 μg/m³.
A remarkable transformation
To fully appreciate the scale of improvement, it’s worth looking back further. In 2016, Putney High Street gained unwanted national attention as the most polluted high street in the UK, with nitrogen dioxide levels reaching 124 μg/m³. The 2024 figure of 34 μg/m³ represents a staggering 73% reduction from that peak.
The report attributes this success to several key interventions:
Low Emission Buses: The introduction of cleaner buses from 2017 onwards, culminating in the conversion of routes 93, 39, 265 and 337 to fully electric buses in 2023, has been transformative. A 2011 study had identified buses as responsible for 68% of NOx emissions despite comprising only 10% of traffic.
Ultra Low Emission Zone (ULEZ): The expansion of ULEZ to include Wandsworth in 2021, followed by the borough-wide expansion in August 2023, has accelerated the retirement of the most polluting vehicles. The report notes a significant 4 μg/m³ reduction in 2022 – the first full year of the extended zone.
Vehicle Fleet Transition: The increasing adoption of electric vehicles and the progressive retirement of older petrol and diesel models has had a cumulative effect, with the report noting that “many of which emit very high pollution levels in real-life driving despite having passed EU lab tests.”
Beyond Putney: Borough-wide trends
The positive news extends across Wandsworth. In 2024, 83% of monitoring locations (45 sites) recorded concentrations lower than in 2023. Of the 54 previously monitored locations, 72% showed reductions of 1-3 μg/m³, while five locations saw reductions of 4-5 μg/m³.
Only one location (W46) recorded a slight increase of 1 μg/m³, while eight locations showed no change from the previous year.
The report notes a significant milestone: “Putney High Street is no longer the most polluted in the Borough; that distinction passed to the bottom end of West Hill” (site W23), which recorded 31 μg/m³ in 2024.
The WHO gap
Despite the progress in meeting UK legal limits, the report acknowledges a stark reality: all borough monitoring sites except one (Felsham Road) fail to meet the stricter World Health Organisation guidelines.
The WHO recommends an annual mean NO₂ concentration of 10 μg/m³ – significantly lower than the UK’s 40 μg/m³ standard, which was set decades ago. Putney High Street’s 34 μg/m³, while legally compliant, is still 3.4 times the WHO recommended level.
Wandsworth Council adopted the WHO interim target of 25 μg/m³ in September 2023 and has incorporated it into their Air Quality Action Plan. The 2024 data shows that 8 sites across the borough (approximately 15% of monitoring locations) now exceed this interim target, down from higher numbers in previous years.
Particulate matter: the harder challenge
While nitrogen dioxide has been the focus of much attention, the report also addresses particulate matter (PM₁₀ and PM₂.₅) – microscopic particles that can penetrate deep into the lungs.
The good news: all five automatic monitoring stations in Wandsworth, including Putney High Street, met the UK National Air Quality Objective for PM₁₀ (40 μg/m³ annual mean). Putney High Street recorded 19 μg/m³ in 2024, a 2 μg/m³ decrease from 2023 and the only monitoring location to show improvement.
The challenge: while meeting UK standards, four of the five stations exceed the WHO guideline of 15 μg/m³ for PM₁₀. Only Felsham Road (14 μg/m³) meets this stricter target.
The report notes that particulate matter presents unique challenges: “Around half of UK concentrations of all PMs comes from anthropogenic sources in the UK, such as wood burning and tyre and brake wear from vehicles.” Additionally, PM₁₀ can travel large distances, with pollution episodes often originating from agriculture and industry in continental Europe.
Infrastructure updates
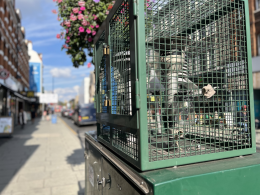
The 2024 report documents a significant investment in monitoring infrastructure. Due to aging equipment and frequent technical failures, the council replaced outdated automatic monitoring equipment, enclosures, and plinths across all five borough stations during 2024.
This infrastructure renewal caused some data gaps – three monitors (Putney High Street, Thessaly Road, and Clapham Junction) achieved less than 75% data capture. However, sufficient data was collected to annualise the results in accordance with technical guidance, ensuring the 2024 findings remain robust.
Putney-specific initiatives
The report details several measures specifically targeting Putney’s air quality:
Traffic Management: Public realm improvements on Putney High Street from September to December 2024 aimed to reduce bottlenecks, including:
- Relocating bus stops northward and marking two lanes at Putney Bridge
- Fine-tuning road markings to increase the length of two-lane sections
- Shortening the yellow box junction at the Embankment
- Optimising the SCOOT traffic signal system
Bus Lane Hours: Extension of bus lane operating hours to 7am-7pm on Putney Bridge Road, which “improves bus journey times also provides additional facility for pedal cycles supporting active travel, modal shift and therefore leading to less pollution.”
Enforcement: Increased enforcement to reduce delays caused by illegal loading, and correction of incorrectly signed loading bays that were negatively affecting traffic flow.
Looking ahead
The report maintains an optimistic outlook: “The improving trend is expected to continue, driven by the switchover to electric cars, vans and buses, and progressive retirement of older petrol and diesel models.”
However, it acknowledges the scale of the challenge ahead, particularly for particulate matter: “It will be a challenge to drive down particulate matter concentrations to these [WHO] levels in Wandsworth based on borough monitoring data to date. The same can be said for all London Boroughs.”

What The Numbers Mean for Putney
For Putney residents, the 2024 report offers genuine cause for optimism tempered with realism:
The Progress: Air quality has dramatically improved and now meets UK legal standards after decades of exceedances. The 75% reduction since 2012 represents one of London’s most significant air quality success stories.
The Reality: Pollution levels remain 2-3 times higher than WHO recommendations, which are based on the latest health evidence. Vulnerable groups – children, the elderly, and those with respiratory conditions – remain at risk even at current “legal” levels.
The Future: The transition to zero-emission vehicles will continue to drive improvements, but the pace may slow as the “easy wins” from replacing the dirtiest vehicles are exhausted. Particulate matter from brake wear, tyre wear, and wood burning will become increasingly significant contributors as exhaust emissions decline.
It’s important to note the specific context affecting these results:
Measurement Locations: The official monitoring primarily captures High Street conditions. The recent traffic congestion has raised concerns about displacement to side streets, prompting the installation of additional monitors on Chelverton, Disraeli, Werter and Weiss Roads in September 2025 (results not yet available).
Temporal Factors: The 2024 improvements were recorded during a period when the Putney Bridge junction redesign had not yet been fully implemented. The impact of subsequent congestion on annual averages will only become clear in the 2025 report.
Weather and Regional Factors: Annual variations can be influenced by meteorological conditions and regional pollution episodes, particularly for particulate matter.
In conclusion
Wandsworth’s 2024 Air Quality Status Report documents continued progress in Putney and across the borough. The data vindicates over a decade of sustained effort by the Putney Society, Wandsworth Council, Transport for London, and successive Mayors of London.
However, the report also serves as a reminder that meeting legal standards, while important, is not the same as achieving truly clean air. The gap between current levels and WHO guidelines represents thousands of premature deaths and respiratory illnesses across London annually.
For Putney, the journey from “most polluted high street” to a location that meets UK standards has taken eight years of determined action. The journey to WHO-recommended levels may take considerably longer.
Key Statistics from the 2024 Report:
- Putney High Street (W24) NO₂: 34 μg/m³ (down from 38 in 2023, 55 in 2018, 124 in 2016)
- UK Legal Limit: 40 μg/m³ ✓ Met
- WHO Interim Target: 25 μg/m³ ✗ Exceeded
- WHO Guideline: 10 μg/m³ ✗ Exceeded
- Putney High Street PM₁₀: 19 μg/m³
- Borough-wide Improvement: 83% of sites showed reduced NO₂ in 2024
- Compliance Rate: 85% of borough sites now meet WHO interim target (25 μg/m³)
The full Annual Air Quality Status Report 2024 is available here. For live air quality data, visit londonair.org.uk.
Note *: The report states it was published in May 2025. In reality, it first became publicly available/visible sometime in September 2025 on a council webpage.


