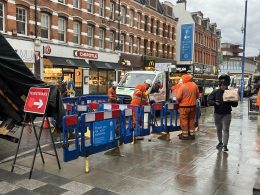
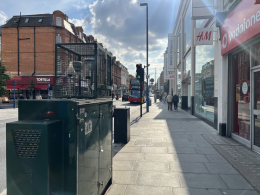
Wandsworth Council and the Putney Society have installed additional air quality monitoring equipment on residential side streets in Putney following concerns about traffic displacement caused by recent junction changes at Putney Bridge.
The new nitrogen dioxide (NO₂) diffusion tubes were installed on 30 September on Chelverton and Disraeli Roads by the Putney Society, with the Council adding two more monitors on Werter and Weiss Roads. The initiative comes as residents in formerly quiet residential streets have expressed concerns about pollution from daily traffic queues outside their homes.
The monitoring extension addresses a paradox that has emerged in recent months. While official air quality data shows pollution levels on Putney High Street continuing to fall and now meet UK legal limits, residents on surrounding streets have experienced unprecedented traffic congestion following the redesign of the Putney Bridge junction.
“With the recent congestion, it is clear that some side roads have increased pollution, but to date there has been no data to show just how bad it is,” explains Robert Arguile, Chair of the Putney Society.
The council acknowledged the situation in an October 2025 letter [pdf] to residents, stating: “We fully acknowledge and appreciate that traffic levels and journey times have been worse than originally predicted following works in the area to improve pedestrian and cycle facilities.”
Understanding the data timeline
The first set of tubes from the September installation will be sent to the laboratory at the end of October, with results expected to take several weeks to process. This represents just the beginning of a longer monitoring programme.
Air quality monitoring using diffusion tubes is not an exact science, and reliable data typically requires extended observation periods. Monthly readings can vary significantly due to weather conditions, wind patterns and temperature fluctuations. The Putney Society, which has been monitoring eight pollution hotspots in Putney since July 2022, emphasises the importance of looking at long-term trends rather than isolated monthly readings.
“There are random fluctuations, often the result of weather patterns, but the trend is clear when you look over time,” notes the Society’s recent monitoring reports.
The bigger picture
The new side road monitoring comes at a complex moment in Putney’s air quality story. The official monitoring sites on Putney High Street show remarkable progress: nitrogen dioxide levels have fallen approximately 75% since 2012 and now sit at around 34 μg/m³ – below the UK legal limit of 40 μg/m³ for the first time since monitoring began.
This improvement has been achieved through a sustained campaign of measures including:
- Introduction of electric and low-emission buses
- Expansion of the Ultra Low Emission Zone (ULEZ)
- Increased uptake of electric cars and vans
- Delivery restrictions and traffic management schemes
However, these measured improvements are at established monitoring sites on the High Street itself. The recent congestion has raised questions about whether pollution has effectively been displaced into residential areas where, until now, no monitoring has taken place.
Council response to congestion
Wandsworth Council is working with Transport for London (TfL) on multiple measures to address the traffic problems, with changes scheduled through to January 2026. These include:
- Adjusting signal timings at key junctions
- Reassigning lanes on Putney High Street
- Trial suspension of bus lanes at specific locations
- Relocating bus stops to improve traffic flow
- Installing double yellow lines to prevent obstruction
The council’s October letter noted: “Additional traffic surveys have been commissioned to help monitor traffic displacement on residential roads. Air quality monitoring has been ongoing and additional nitrogen dioxide monitors have been installed.”
What happens next
The monitoring programme will continue for several months to build up a reliable picture of air quality conditions on the affected side streets. The Putney Society and Council will analyse the data to identify any concerning trends and determine whether additional interventions are needed.
Results from the new monitoring sites will be compared with the longer-term data from the eight existing Putney monitoring locations, which show a general downward trend in pollution levels averaging around 25 μg/m³ – still well above the World Health Organisation’s recommended guideline of 10 μg/m³ for annual mean NO₂ concentrations, but significantly below the UK legal limit.
“We will continue to refine our efforts, including reviewing locations for measuring the level and types of pollution, as well as press the council and TfL for changes to keep air pollution in Putney on its downward trend,” the Putney Society stated in a recent bulletin.
The council has committed to sending regular communications to residents on progress with the congestion-reduction works. A detailed report is scheduled for presentation at the Transport Committee on 20 November 2025.
Residents with concerns about air quality in Putney can check live and historic data at the London Air Quality Network (londonair.org.uk) and Breathe London Communities.


